

In this tutorial, use Power Query's Query Editor to import data from a local Excel file that contains product information and from an OData feed that contains product order information. Perform transformation and aggregation steps, and combine data from both sources to create a Total Sales per Product and Year report.
To complete this tutorial, you need the Products workbook. In the Save As dialog box, name the file Products and Orders.xlsx.
Task 1: Import products into an Excel workbook
In this task, you import products from the Products and Orders.xlsx file (downloaded and renamed in the previous section) into an Excel workbook. Then, you promote rows to column headers, remove some columns, and load the query to a worksheet.
Step 1: Connect to an Excel workbook
- Create an Excel workbook.
- Select Data > Get Data > From File > From Workbook.
- In the Import Data dialog box, browse for and locate the Products.xlsx file you downloaded, and then select Open.
- In the Navigator pane, double-click the Products table. The Power Query Editor appears.
Step 2: Examine the Query Steps
By default, Power Query automatically adds several steps as a convenience for you. Examine each step under Applied Steps in the Query Settings pane to learn more.
- Right-click the Source step, and select Edit Settings. This step was created when you imported the workbook.
- Right-click the Navigation step, and select Edit Settings. This step was created when you selected the table from the Navigation dialog box.
- Right-click the Changed Type step, and select Edit Settings. This step was created by Power Query which inferred the data types of each column. Select the down arrow to the right of the formula bar to see the complete formula.
Step 3: Remove other columns to only display columns of interest
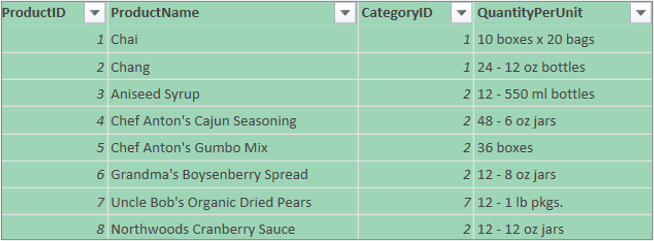
In this step, you remove all columns except ProductID, ProductName, CategoryID, and QuantityPerUnit.
- In Data Preview, select the ProductID, ProductName, CategoryID, and QuantityPerUnit columns (use Ctrl+Click or Shift+Click).
- Select Remove Columns > Remove Other Columns.
Step 4: Load the products query
In this step, you load the Products query into an Excel worksheet.
- Select Home > Close & Load. The query appears in a new Excel worksheet.
Summary: Power Query steps created in Task 1
As you perform query activities in Power Query, it creates query steps and lists them in the Query Settings pane, in the Applied Steps list. Each query step has a corresponding Power Query formula, also known as the "M" language. For more information about Power Query formulas, see Power Query documentation.
| Task | Query step | Formula |
|---|---|---|
| Import an Excel workbook | Source | = Excel.Workbook(File.Contents("C:\Products and Orders.xlsx"), null, true) |
| Select the Products table | Navigate | = Source{[Item="Products",Kind="Table"]}[Data] |
| Power Query automatically detects column data types | Changed Type | = Table.TransformColumnTypes( Products_Table,{{"ProductID", Int64.Type}, {"ProductName", type text}, {"SupplierID", Int64.Type}, {"CategoryID", Int64.Type}, {"QuantityPerUnit", type text}, {"UnitPrice", type number}, {"UnitsInStock", Int64.Type}, {"UnitsOnOrder", Int64.Type}, {"ReorderLevel", Int64.Type}, {"Discontinued", type logical}}) |
| Remove other columns to only display columns of interest | Removed Other Columns | = Table.SelectColumns(FirstRowAsHeader,{"ProductID", "ProductName", "CategoryID", "QuantityPerUnit"}) |
Task 2: Import order data from an OData feed
In this task, you import data into your Excel workbook from the sample Northwind OData feed at http://services.odata.org/Northwind/Northwind.svc, expand the Order_Details table, remove columns, calculate a line total, transform an OrderDate, group rows by ProductID and Year, rename the query, and disable query download to the Excel workbook.
Step 1: Connect to an OData Feed
- Select Data > Get Data > From Other Sources > From OData Feed.
- In the OData Feed dialog box, enter the URL for the Northwind OData feed.
- Select OK.
- In the Navigator pane, double-click the Orders table.
Step 2: Expand an Order_Details table
In this step, you expand the Order_Details table that is related to the Orders table, to combine the ProductID, UnitPrice, and Quantity columns from Order_Details into the Orders table. The Expand operation combines columns from a related table into a subject table. When the query runs, rows from the related table (Order_Details) are combined into rows with the primary table (Orders).
In Power Query, a column containing a related table has the value Record or Table in the cell. These are called structured columns. Record indicates a single related record and represents a one-to-one relationship with the current data or primary table. Table indicates a related table and represents a one-to-many relationship with the current or primary table. A structured column represents a relationship in a data source that has a relational model. For example, a structured column indicates an entity with a foreign key association in an OData feed or foreign key relationship in a SQL Server database.
After you expand the Order_Details table, three new columns and additional rows are added to the Orders table, one for each row in the nested or related table.
In Data Preview, scroll horizontally to the Order_Details column.
In the Order_Details column, select the expand icon (
 ).
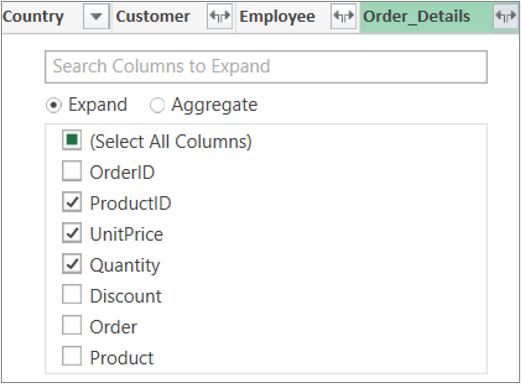
).In the Expand drop-down:
Select (Select All Columns) to clear all columns.
Select ProductID, UnitPrice, and Quantity.
Select OK.
Note
In Power Query, you can expand tables linked from a column and aggregate the columns of the linked table before expanding the data in the subject table. For more information about how to perform aggregate operations, see Aggregate data from a column (Power Query).
Step 3: Remove other columns to only display columns of interest
In this step, you remove all columns except OrderDate, ProductID, UnitPrice, and Quantity columns.
In Data Preview, select the following columns:
- Select the first column, OrderID.
- Shift+Click the last column, Shipper.
- Ctrl+Click the OrderDate, Order_Details.ProductID, Order_Details.UnitPrice, and Order_Details.Quantity columns.
Right-click on a selected column header, and select Remove Other Columns.
Step 4: Calculate the line total for each Order_Details row
In this step, you create a Custom Column to calculate the line total for each Order_Details row.
- In Data Preview, select the table icon (
 ) at the top-left corner of the preview.
 - Select Add Custom Column.
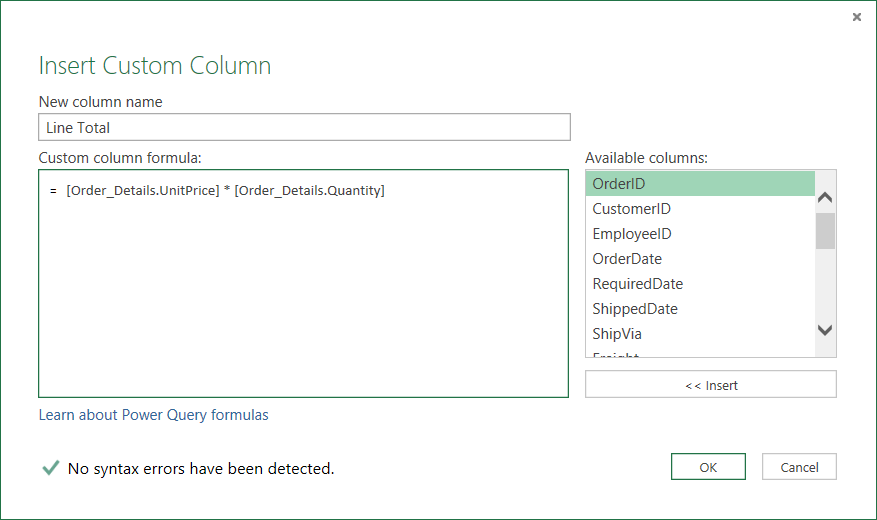
- In the Custom Column dialog box, in the Custom column formula box, enter [Order_Details.UnitPrice] * [Order_Details.Quantity].
- In the New column name box, enter Line Total.
- Select OK.
Step 5: Transform an OrderDate year column
In this step, you transform the OrderDate column to render the order date year.
In Data Preview, right-click the OrderDate column, and select Transform > Year.
Rename the OrderDate column to Year:
- Double-click the OrderDate column, and enter Year or
- Right-click the OrderDate column, select Rename, and enter Year.
Step 6: Group rows by ProductID and Year
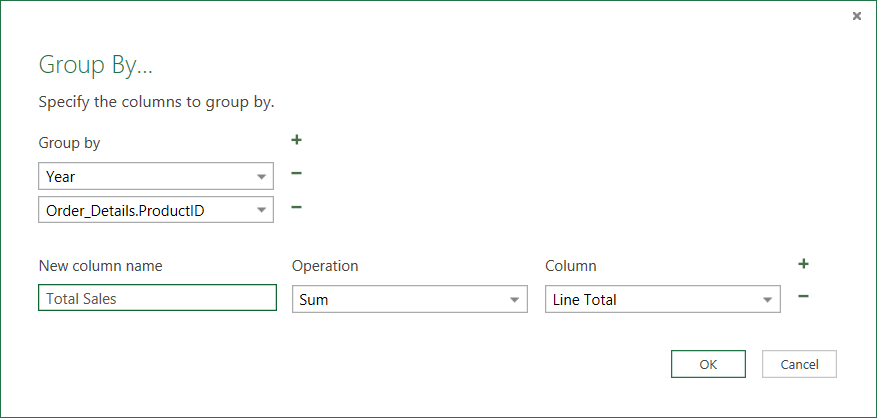
In Data Preview, select Year and Order_Details.ProductID.
Right-click one of the headers, and select Group By.
In the Group By dialog box:
- In the New column name textbox, enter Total Sales.
- In the Operation drop-down, select Sum.
- In the Column drop-down, select Line Total.
Select OK.
Before you import the sales data into Excel, rename the query:
- In the Query Settings pane, in the Name box enter Total Sales.
Results: Final query for Task 2
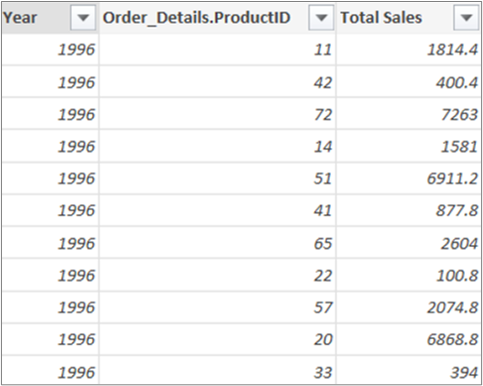
After you perform each step, you have a Total Sales query over the Northwind OData feed.
Summary: Power Query steps created in Task 2
As you perform query activities in Power Query, it creates query steps and lists them in the Query Settings pane, in the Applied Steps list. Each query step has a corresponding Power Query formula, also known as the "M" language. For more information about Power Query formulas, see Power Query documentation.
| Task | Query step | Formula |
|---|---|---|
| Connect to an OData feed | Source | = OData.Feed("http://services.odata.org/Northwind/Northwind.svc", null, [Implementation="2.0"]) |
| Select a table | Navigation | = Source{[Name="Orders"]}[Data] |
| Expand the Order_Details table | Expand Order_Details | = Table.ExpandTableColumn(Orders, "Order_Details", {"ProductID", "UnitPrice", "Quantity"}, {"Order_Details.ProductID", "Order_Details.UnitPrice", "Order_Details.Quantity"}) |
| Remove other columns to only display columns of interest | RemovedColumns | = Table.RemoveColumns(#"Expand Order_Details",{"OrderID", "CustomerID", "EmployeeID", "RequiredDate", "ShippedDate", "ShipVia", "Freight", "ShipName", "ShipAddress", "ShipCity", "ShipRegion", "ShipPostalCode", "ShipCountry", "Customer", "Employee", "Shipper"}) |
| Calculate the line total for each Order_Details row | Added Custom | = Table.AddColumn(RemovedColumns, "Custom", each [Order_Details.UnitPrice] * [Order_Details.Quantity]) = Table.AddColumn(#"Expanded Order_Details", "Line Total", each [Order_Details.UnitPrice] * [Order_Details.Quantity]) |
| Change to a more meaningful name, Lne Total | Renamed Columns | = Table.RenameColumns(InsertedCustom,{{"Custom", "Line Total"}}) |
| Transform the OrderDate column to render the year | Extracted Year | = Table.TransformColumns(#"Grouped Rows",{{"Year", Date.Year, Int64.Type}}) |
| Change to more meaningful names, OrderDate and Year |
Renamed Columns 1 | Table.RenameColumns (TransformedColumn,{{"OrderDate", "Year"}}) |
| Group rows by ProductID and Year | GroupedRows | = Table.Group(RenamedColumns1, {"Year", "Order_Details.ProductID"}, {{"Total Sales", each List.Sum([Line Total]), type number}}) |
Task 3: Combine the Products and Total Sales queries
Power Query enables you to combine multiple queries by merging or appending them. You can perform the Merge operation on any Power Query query with a tabular shape, regardless of the data source. For more information about combining data sources, see Combine multiple queries (Power Query).
In this task, you combine the Products and Total Sales queries by using a Merge query and Expand operation, and then load the Total Sales per Product query into the Excel Data Model.
Step 1: Merge ProductID into a Total Sales query
In the Excel workbook, go to the Products query on the Products worksheet tab.
Select a cell in the query, and then select Query > Merge.
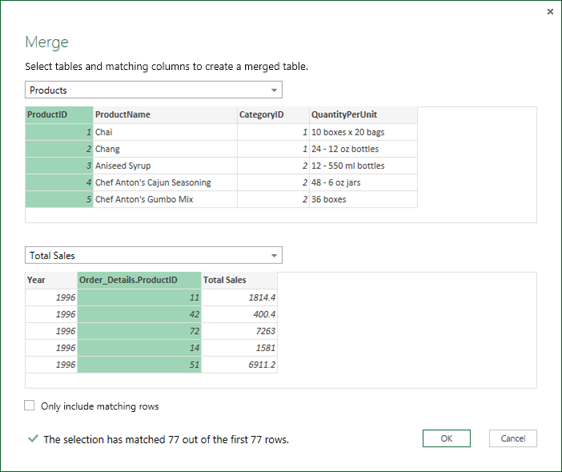
In the Merge dialog box, select Products as the primary table, and select Total Sales as the secondary or related query to merge. Total Sales becomes a new structured column with an expand icon.
To match Total Sales to Products by ProductID, select the ProductID column from the Products table, and the Order_Details.ProductID column from the Total Sales table.
In the Privacy Levels dialog box:
- Select Organizational for your privacy isolation level for both data sources.
- Select Save.
Select OK.
Note
Privacy Levels prevent a user from inadvertently combining data from multiple data sources, which might be private or organizational. Depending on the query, a user could inadvertently send data from the private data source to another data source that might be malicious. Power Query analyzes each data source and classifies it into the defined level of privacy: Public, Organizational, and Private. For more information about Privacy Levels, see Set Privacy Levels (Power Query).
Result
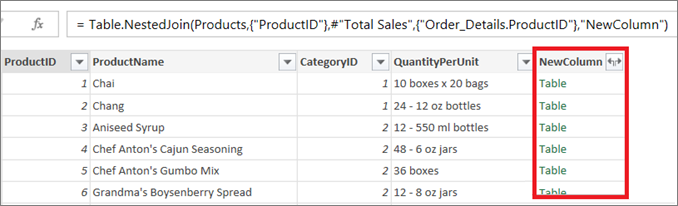
The Merge operation creates a query. The query result contains all columns from the primary table (Products), and a single Table structured column to the related table (Total Sales). Select the Expand icon to add new columns to the primary table from the secondary or related table.
Step 2: Expand a merged column
In this step, you expand the merged column with the name NewColumn to create two new columns in the Products query: Year and Total Sales.
In Data Preview, select Expand icon (
) next to NewColumn.In the Expand drop-down list:
- Select (Select All Columns) to clear all columns.
- Select Year and Total Sales.
- Select OK.
Rename these two columns to Year and Total Sales.
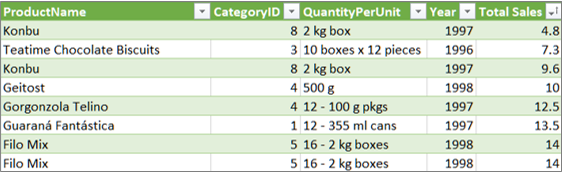
To find out which products and in which years the products got the highest volume of sales, select Sort Descending by Total Sales.
Rename the query to Total Sales per Product.
Result
Step 3: Load a Total Sales per Product query into an Excel Data Model
In this step, you load a query into an Excel Data Model, so you can build a report connected to the query result. After you load data into the Excel Data Model, you can use Power Pivot to further your data analysis.
- Select Home > Close & Load.
- In the Import Data dialog box, make sure you select Add this data to the Data Model. For more information about using this dialog box, select the question mark (?).
Result
You have a Total Sales per Product query that combines data from the Products.xlsx file and Northwind OData feed. This query is applied to a Power Pivot model. In addition, changes to the query modify and refresh the resulting table in the Data Model.
Summary: Power Query steps created in Task 3
As you perform Merge query activities in Power Query, query steps are created and listed in the Query Settings pane, in the Applied Steps list. Each query step has a corresponding Power Query formula, also known as the "M" language. For more information about Power Query formulas, see Power Query documentation.
| Task | Query step | Formula |
|---|---|---|
| Merge ProductID into the Total Sales query | Source (data source for Merge operation) | = Table.NestedJoin(Products, {"ProductID"}, #"Total Sales", {"Order_Details.ProductID"}, "Total Sales", JoinKind.LeftOuter) |
| Expand a merge column | Expanded Total Sales | = Table.ExpandTableColumn(Source, "Total Sales", {"Year", "Total Sales"}, {"Total Sales.Year", "Total Sales.Total Sales"}) |
| Rename two columns | Renamed Columns | = Table.RenameColumns(#"Expanded Total Sales",{{"Total Sales.Year", "Year"}, {"Total Sales.Total Sales", "Total Sales"}}) |
| Sort total Sales in ascending order | Sorted Rows | = Table.Sort(#"Renamed Columns",{{"Total Sales", Order.Ascending}}) |